About Course
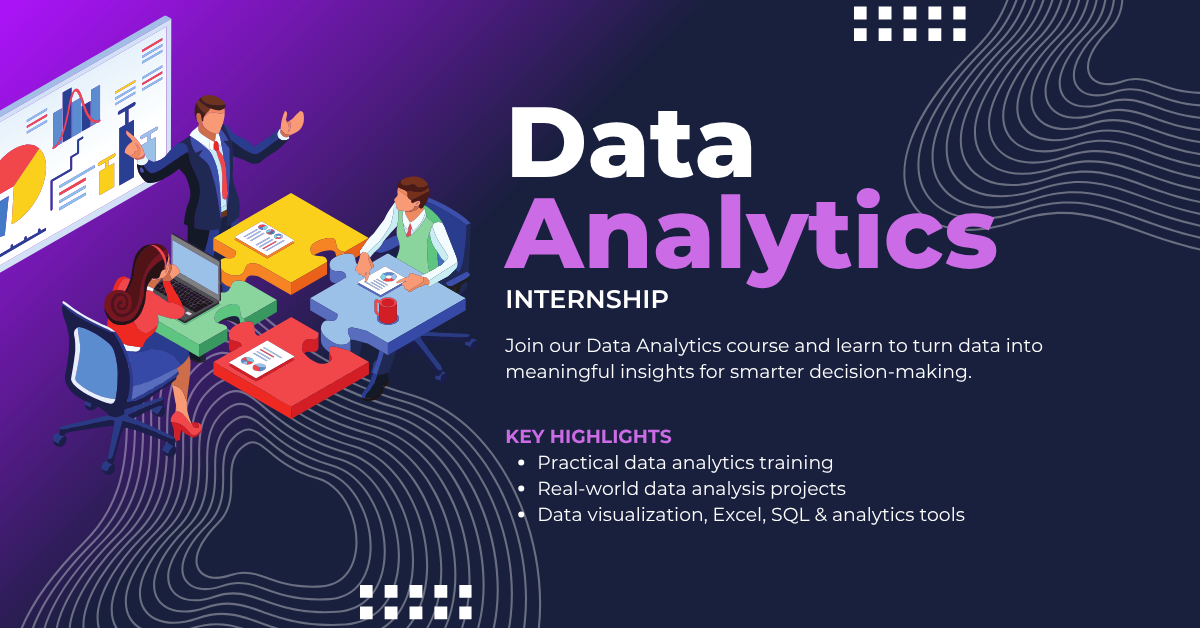
This 6-month Data Analytics Internship is a structured, industry-focused training program designed to transform beginners into job-ready data analysts with strong analytical thinking, data handling skills, and practical experience using modern analytics tools and techniques.
The program follows a progressive learning approach, starting from fundamental concepts of data handling and gradually advancing toward real-world data analysis, visualization, and business decision-making. It is designed to build both conceptual understanding and hands-on experience through datasets, case studies, assignments, and project-based learning.
🚀 What This Internship Covers
The internship begins with the fundamentals of data and analytics, where learners understand what data is, how it is collected, structured, and used in real business environments. Core concepts such as data types, data sources, and basic statistics are introduced to build a strong analytical foundation.
Next, learners move into Excel for Data Analysis, one of the most widely used tools in the industry. They work with formulas, functions, pivot tables, charts, data cleaning techniques, and basic reporting. This phase focuses on building speed and accuracy in handling structured data.
After Excel, the program transitions into SQL (Structured Query Language), where learners gain hands-on experience in working with databases. They learn how to extract, filter, join, and analyze data using SQL queries. Topics like SELECT statements, GROUP BY, JOINS, subqueries, and data aggregation are covered in depth.
Once database skills are established, learners are introduced to Python for Data Analysis. They work with libraries such as Pandas, NumPy, and Matplotlib to clean, manipulate, and analyze large datasets. This phase focuses on automation, efficiency, and handling real-world messy data.
The next stage focuses on Data Visualization and Business Intelligence tools such as Power BI or Tableau. Learners create interactive dashboards, reports, and visual insights that help in business decision-making. They learn how to translate raw data into meaningful visual stories.
In the final phase, learners work on a Real-World Capstone Project, where they analyze a complete dataset from scratch. This includes data cleaning, analysis, visualization, and presenting insights in a structured business report or dashboard, simulating real industry analytics workflows.
🧠 Learning Approach
This internship is fully practical and skill-oriented, not theory-heavy. Each module includes:
-
Structured lessons with real datasets
-
Hands-on exercises and problem-solving tasks
-
Module-wise quizzes to test analytical understanding
-
Assignments focused on real business scenarios
-
Mini-projects for applied learning
-
A final capstone analytics project
Progression is sequential, meaning learners must complete assessments before moving to advanced topics. This ensures strong conceptual clarity and practical readiness.
🏆 Skills You Will Gain
By the end of this internship, participants will be able to:
-
Understand and work with structured and unstructured data
-
Perform data cleaning and preprocessing efficiently
-
Use Excel for professional-level data analysis
-
Write SQL queries for data extraction and reporting
-
Analyze datasets using Python (Pandas, NumPy)
-
Create charts, dashboards, and visual reports
-
Derive insights for business decision-making
-
Work on real-world data analytics problems
-
Build a strong analytics portfolio project
🎯 Who This Internship is For
This program is ideal for:
-
Beginners who want to start a career in data analytics
-
Students from any stream interested in data-driven roles
-
Professionals looking to switch into analytics
-
Anyone aiming for roles like Data Analyst or Business Analyst
No prior experience in programming or analytics is required, but consistency, logical thinking, and practice are necessary to complete the program successfully.
💼 Internship Outcome
After completing this internship, learners will have practical experience in data analysis workflows and will be capable of handling real business datasets independently. They will also build a strong portfolio project featuring dashboards, insights, and analytical reports, which can be directly showcased to employers for data analyst roles.
Course Content
Module 1: Introduction to Data Analytics & Environment Setup
-
What is Data Analytics?
-
Types of Data Analytics
-
Data Analytics Lifecycle
-
Check what have you learnt about Data Analytics Basics Check
-
Basic Sales Data Analyzer
Module 2: Python Fundamentals for Data Analytics
Module 3: Data Handling with NumPy (Numerical Computing)
Module 4: Data Handling with Pandas (Data Manipulation & Cleaning)
Module 5: Exploratory Data Analysis (EDA)
Module 6: Data Visualization with Advanced Techniques (Matplotlib & Seaborn)
Module 7: Statistics for Data Analytics
Module 8: SQL for Data Analytics
Module 9: Data Analytics with Python Integration (SQL + Pandas + Real Data Pipelines)
Module 10: Business Intelligence & Data Storytelling
Module 11: Capstone Project – End-to-End Data Analytics System
Earn a certificate
Add this certificate to your resume to demonstrate your skills & increase your chances of getting noticed.