5.00
(1 Rating)

3 Months Data Analytics Training & Internship

Categories: Training & Internship
Wishlist Share

About Course

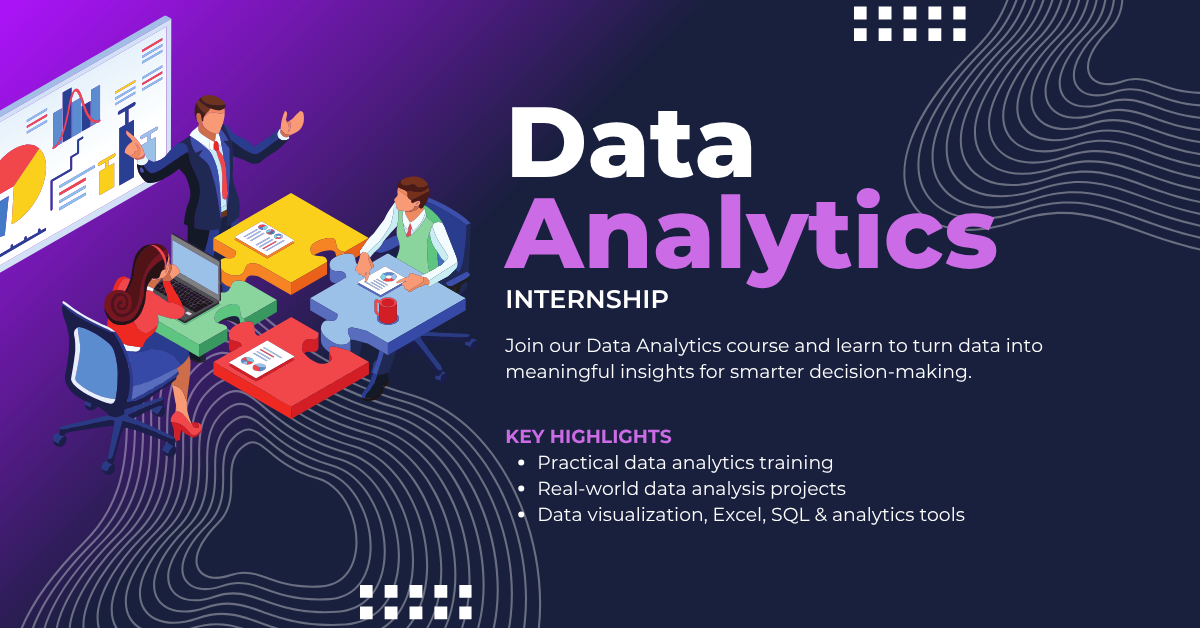
This 3-month Data Analytics Internship is a structured, industry-oriented training program designed to help beginners build strong analytical, data interpretation, and reporting skills using modern data analytics tools and technologies.

The program follows a progressive learning approach, starting from the fundamentals of data analytics and gradually advancing toward real-world data analysis, visualization, reporting, and business insight generation. It is designed to provide both conceptual clarity and hands-on practical experience through assignments, quizzes, case studies, and project-based learning.

🚀 What This Internship Covers

The internship begins with the fundamentals of data analytics, where learners understand how organizations use data to make business decisions, identify trends, improve operations, and generate insights. Students learn key concepts such as data collection, data cleaning, business metrics, analytical thinking, and reporting fundamentals.

Once the basics are established, the program moves into Microsoft Excel and spreadsheet analytics. Learners gain practical experience with formulas, functions, pivot tables, charts, conditional formatting, lookup functions, data cleaning techniques, and dashboard creation used in business reporting and analysis.

Next, students are introduced to SQL and database fundamentals, where they learn how to retrieve, filter, organize, and analyze structured data using SQL queries. Topics include SELECT statements, filtering, sorting, grouping, joins, aggregations, subqueries, and relational database concepts used in real-world analytics environments.

The internship then transitions into Python for Data Analytics, where learners work with libraries such as Pandas, NumPy, and Matplotlib to perform data cleaning, transformation, analysis, and visualization. Students gain understanding of datasets, DataFrames, exploratory data analysis, and statistical insights generation through practical coding exercises.

The program also covers data visualization and dashboard development using tools such as Power BI or Tableau. Learners create interactive dashboards, KPI reports, business visualizations, and analytical reports that transform raw data into meaningful business insights.

In the final phase, learners apply everything they have learned by building a complete real-world Data Analytics Project, such as Sales Performance Analysis, Customer Behavior Dashboard, HR Analytics Report, E-commerce Data Analysis, or Business Insights Dashboard. This project simulates real industry data analysis workflows and reporting processes.

🧠 Learning Approach

This internship is designed around practical implementation, analytical thinking, and continuous evaluation. Each module includes:

  • Structured video/text lessons

  • Hands-on data analysis exercises

  • Real-world business datasets

  • Module-wise quizzes and assessments

  • Dashboard-building assignments

  • Mini-projects for practical learning

  • A final capstone analytics project

Progression is structured sequentially, ensuring learners develop strong understanding of each concept before advancing to more advanced analytical techniques and tools.

🏆 Skills You Will Gain

By the end of this internship, participants will be able to:

  • Understand data analytics fundamentals

  • Analyze and interpret business datasets

  • Use Microsoft Excel for reporting and analysis

  • Write SQL queries for data extraction and analysis

  • Perform data cleaning and transformation

  • Use Python libraries such as Pandas and NumPy

  • Create charts, dashboards, and visual reports

  • Build interactive dashboards using Power BI/Tableau

  • Generate business insights from raw data

  • Work on real-world analytics projects

  • Understand end-to-end data analysis workflows

🎯 Who This Internship is For

This program is ideal for:

  • Beginners interested in Data Analytics or Business Analytics

  • Students pursuing computer science, IT, BCA, BBA, MBA, or related fields

  • Individuals looking to start a career in analytics or reporting

  • Professionals wanting to strengthen data analysis skills

  • Anyone interested in working with business data and dashboards

No prior programming or analytics experience is required, but consistency, curiosity, and willingness to practice are important for successful completion.

💼 Internship Outcome

Upon completion of this internship, learners will have practical experience in data analysis, reporting, dashboard creation, and business insight generation using industry-relevant tools and technologies.

Participants will also complete a portfolio-ready Data Analytics project that can be showcased to potential employers, significantly improving their opportunities for roles such as Data Analyst, Business Analyst, Reporting Analyst, Junior Data Scientist, and Analytics Associate.

Show More

Course Content

Module 1: Introduction to Data Analytics & Tools Setup
This module serves as the foundation of the entire Data Analytics Internship program and is designed to introduce learners to the real-world role of data analytics in modern organizations. It provides a strong conceptual understanding of how businesses use data to make informed decisions, improve operations, identify trends, and solve practical problems. Students will explore how raw, unstructured information is transformed into meaningful insights that support strategic planning and business growth. The module begins by explaining the responsibilities of a data analyst and the importance of analytics across industries such as finance, healthcare, e-commerce, marketing, and technology. Learners will understand the complete analytics workflow, starting from data collection and cleaning to analysis, visualization, and reporting. Special focus is given to understanding how data flows through a typical analytics pipeline and how different stages contribute to accurate decision-making. Students will also be introduced to the core ecosystem of tools widely used in the analytics industry, including Excel for spreadsheet-based analysis, SQL for querying and managing databases, and Python for data processing and automation. The module explains how these technologies work together in real analytics projects and why they are considered essential skills for every aspiring data analyst.

  • Introduction to Data Analytics
  • Types of Data & Data Lifecycle
  • Setting Up Data Analytics Tools
  • Introduction to Pandas (Python Library)
  • Check what have you learnt about Data Analytics Basics Check
  • Basic Student Performance Analyzer

Module 2: Data Handling with Excel, Data Cleaning & SQL Basics
This module focuses on how real-world data is prepared and managed before actual analysis begins. In practical industry environments, raw data is rarely clean or organized, which makes data handling one of the most important skills for any data analyst. You will learn how Excel is used for reporting, calculations, and quick business analysis, while also understanding how data cleaning improves accuracy and reliability in analytics workflows. The module also introduces SQL, the standard language used for working with databases and retrieving information efficiently from large datasets. Along with this, you will understand how formatting and standardization help maintain consistency across data sources. By the end of this module, you will be able to clean, organize, query, and prepare messy datasets for meaningful analysis and decision-making.

Module 3: SQL for Data Analysis (Intermediate Querying & Data Extraction)
This module is designed to build strong SQL skills required in real-world data analyst and business intelligence roles. SQL is one of the most important technologies used to retrieve, filter, organize, and analyze data stored inside relational databases. In modern companies, databases contain millions of records, and SQL helps analysts extract meaningful insights quickly and efficiently. You will learn how to write practical SQL queries used in reporting systems, dashboards, analytics platforms, and enterprise applications. The module covers filtering, sorting, grouping, aggregation, joins, and subqueries, which are essential for solving real business problems. By the end of this module, you will be able to independently query and analyze structured datasets using industry-standard SQL techniques.

Module 4: Python for Data Analysis (Pandas Deep Dive + NumPy Basics)
This module focuses on using Python as a professional data analysis tool for handling, transforming, and analyzing real-world datasets. While earlier modules introduced the basics of data handling, this module goes deeper into advanced data manipulation techniques using Pandas and introduces NumPy for fast numerical computation. These tools are widely used in data analytics, machine learning, artificial intelligence, finance, healthcare, and business intelligence systems. You will learn how analysts filter data, perform grouping operations, merge datasets, and execute statistical calculations efficiently using Python. The module also explains how large datasets are processed using optimized data structures and vectorized operations. By the end of this module, you will be able to manipulate complex datasets confidently and perform industry-level data analysis tasks using Pandas and NumPy.

Module 5: Data Visualization & Storytelling (Matplotlib + Seaborn)
This module focuses on transforming raw data into meaningful visual insights that are easy to understand and communicate. In data analytics, visualization plays a critical role because large datasets and complex numbers become much easier to interpret through charts, graphs, and dashboards. Businesses use visual reports to identify trends, monitor performance, compare results, and support faster decision-making. You will learn how to create professional visualizations using Matplotlib and Seaborn, two of the most widely used Python libraries for data visualization. The module covers different chart types, statistical plots, heatmaps, and storytelling techniques used in analytics dashboards and business reports. By the end of this module, you will be able to present analytical findings clearly and create professional visual reports that communicate insights effectively.

Module 6: Statistics for Data Analysis (Descriptive + Inferential Statistics)
This module focuses on the statistical concepts required for professional data analysis and decision-making. Statistics helps analysts summarize data, identify patterns, measure relationships, and draw meaningful conclusions from large datasets. In real-world analytics, statistics is essential because raw numbers alone do not provide actionable insights unless they are interpreted correctly using mathematical methods. You will learn both descriptive statistics and inferential statistics, which are widely used in business intelligence, forecasting, machine learning, finance, research, and predictive analytics. The module also introduces probability concepts, measures of dispersion, correlation analysis, and statistical reasoning used in industry-level analytics systems. By the end of this module, you will be able to support your findings with statistical evidence and make more accurate data-driven decisions.

Module 7: Final Capstone Project – End-to-End Data Analyst Project
This final module is the capstone project of the entire internship program and represents a complete real-world data analytics workflow. In this module, you will apply all the concepts learned throughout the internship, including Excel, SQL, Python, Pandas, statistics, data cleaning, and visualization, to solve a business problem using real datasets. The goal is to simulate how professional data analysts work in companies — from understanding the business problem to delivering actionable insights and reports. You will learn how to collect raw data, clean and preprocess it, perform exploratory data analysis (EDA), generate business insights, and build professional visual reports. This module also focuses on analytical thinking, business communication, and decision-making using data. By the end of this project, you will have a portfolio-ready analytics project that demonstrates your end-to-end data analysis capabilities using industry-standard workflows and tools.

Earn a certificate

Add this certificate to your resume to demonstrate your skills & increase your chances of getting noticed.
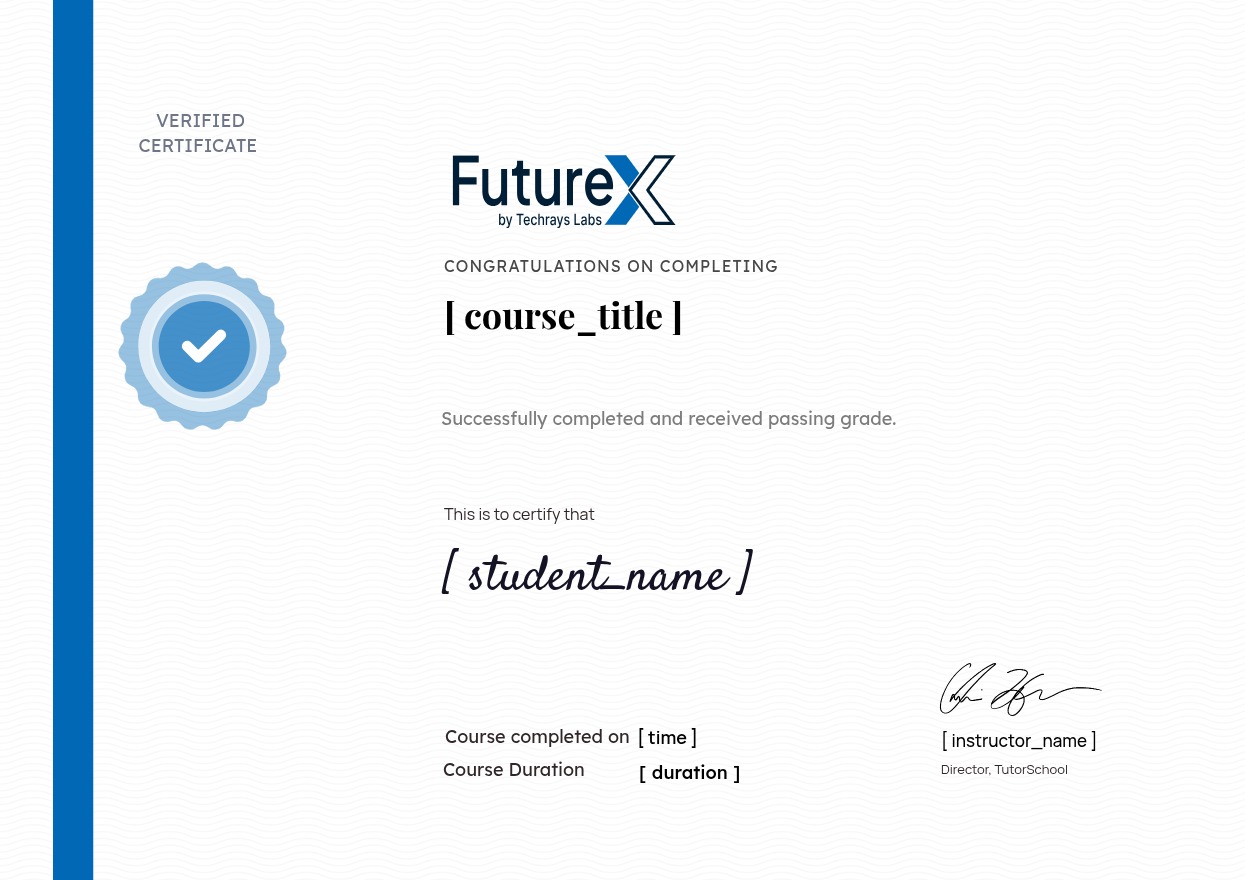

selected template

Student Ratings & Reviews

5.0
Total 1 Rating
5
1 Rating
4
0 Rating
3
0 Rating
2
0 Rating
1
0 Rating
Jibanjyoti Rout
1 month ago
Thank you for your that kind of internship . it also growth my konwledge.