About Course
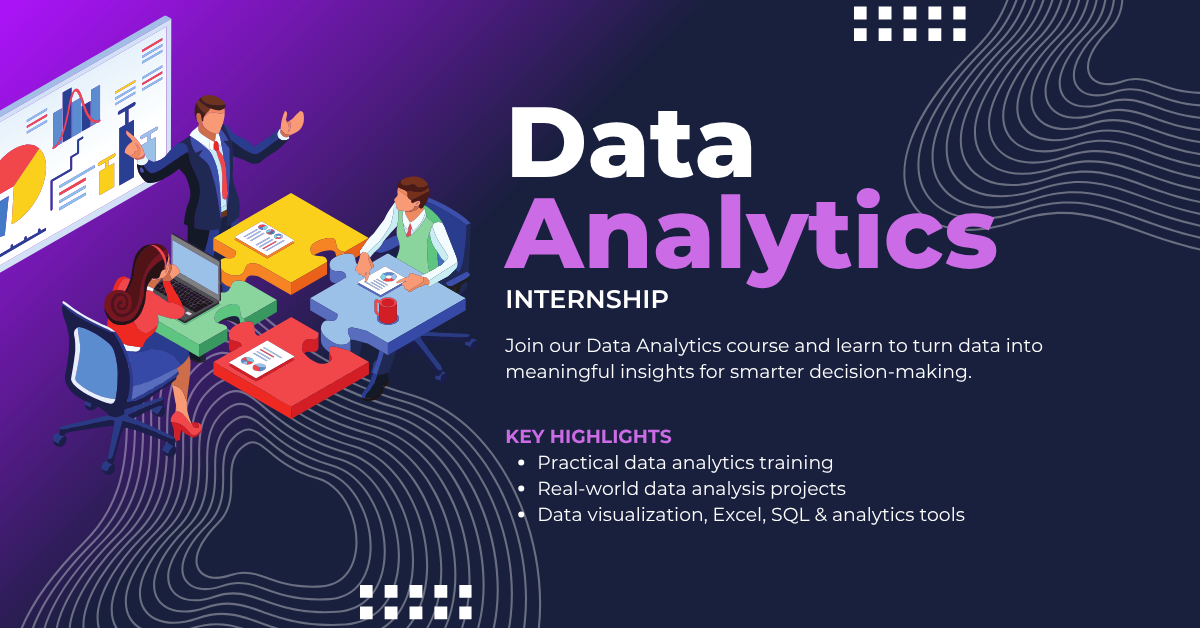
The 15-Days Data Analytics Internship is a practical, industry-oriented program designed to introduce students and aspiring professionals to the world of data analysis. Throughout this internship, participants will learn how to collect, clean, analyze, visualize, and interpret data to support informed business decisions.
Starting with the fundamentals of data analytics, learners will progressively explore Excel, SQL, Python, data visualization tools, and basic statistical concepts used by organizations across industries. Through hands-on exercises, real-world datasets, and guided projects, participants will gain practical experience in solving business problems using data.
By the end of the internship, students will have completed a portfolio-ready analytics project and developed the confidence to work with data in professional environments.
🚀 What This Internship Covers
During this internship, you will learn:
- Introduction to Data Analytics and the Data Analytics Lifecycle
- Data Collection, Cleaning, and Preparation Techniques
- Microsoft Excel for Data Analysis and Reporting
- SQL Fundamentals for Querying and Managing Databases
- Python Basics for Data Analysis using Pandas and NumPy
- Exploratory Data Analysis (EDA)
- Data Visualization using Matplotlib and Seaborn
- Business Metrics and Key Performance Indicators (KPIs)
- Basic Statistics for Data Analysis
- Dashboard Creation and Data Storytelling
- Working with Real-World Business Datasets
- Best Practices for Data-Driven Decision Making
- End-to-End Analytics Project Development
🧠 Learning Approach
This internship follows a learn-by-doing methodology, ensuring students gain practical experience alongside theoretical knowledge. Each module includes easy-to-understand explanations, guided demonstrations, coding exercises, assignments, quizzes, and mini projects that reinforce key concepts.
Participants will work with realistic datasets to perform data cleaning, analysis, visualization, and reporting. Throughout the internship, students will progressively build their analytical thinking and problem-solving skills while learning industry-standard tools and workflows used by data analysts.
The program concludes with a comprehensive capstone project that simulates a real business analytics scenario, helping students apply everything they have learned in a practical setting.
🏆 Skills You Will Gain
After successfully completing this internship, you will be able to:
- Understand the complete data analytics workflow
- Collect, clean, and prepare datasets for analysis
- Analyze data using Microsoft Excel, SQL, and Python
- Write SQL queries to retrieve and manipulate data
- Perform Exploratory Data Analysis (EDA)
- Create insightful charts and dashboards
- Interpret business data to support decision-making
- Apply basic statistical concepts in analytics
- Generate professional reports and visualizations
- Work confidently with real-world datasets
- Present analytical findings using effective data storytelling
- Build a portfolio-ready data analytics project
🎯 Who This Internship is For
This internship is ideal for:
- Undergraduate and postgraduate students
- Beginners interested in Data Analytics
- Computer Science, IT, Engineering, Commerce, and Management students
- Aspiring Data Analysts and Business Analysts
- Fresh graduates seeking practical industry exposure
- Professionals looking to transition into analytics roles
- Anyone interested in learning how data drives business decisions
- Learners with little or no prior programming experience
No prior experience in data analytics is required. The internship is designed to help beginners build a strong foundation before progressing to more advanced analytics concepts.
💼 Internship Outcome
Upon successful completion of the 15-Days Data Analytics Internship, participants will have gained practical experience in analyzing, visualizing, and interpreting data using widely adopted industry tools and techniques.
Students will complete a real-world capstone project that demonstrates their ability to solve business problems using data, making it a valuable addition to their professional portfolio. They will also develop the confidence to work with datasets, create meaningful reports and dashboards, and communicate insights effectively.
By the end of the internship, learners will be well-prepared for entry-level opportunities in Data Analytics, Business Analytics, Reporting, Data Visualization, and related fields, while also building a strong foundation for advanced learning in Data Science and Artificial Intelligence.
Course Content
Module 1: Foundations of Data Analytics & Excel Essentials
-
Lesson 1: Introduction to Data Analytics
-
Lesson 2: Data Types, Data Sources & Analytics Process
-
Lesson 3: Microsoft Excel for Data Analytics
-
Lesson 4: Data Visualization Basics in Excel
-
Data Analytics Fundamentals & Excel Basics Assessment
-
Sales Performance Analysis Using Excel
Module 2: Data Cleaning, Analysis & Visualization using Python (Pandas & Matplotlib)
Module 3: SQL for Data Analytics & Business Insights
Module 4: Capstone Project – Retail Sales & Business Performance Analytics Dashboard
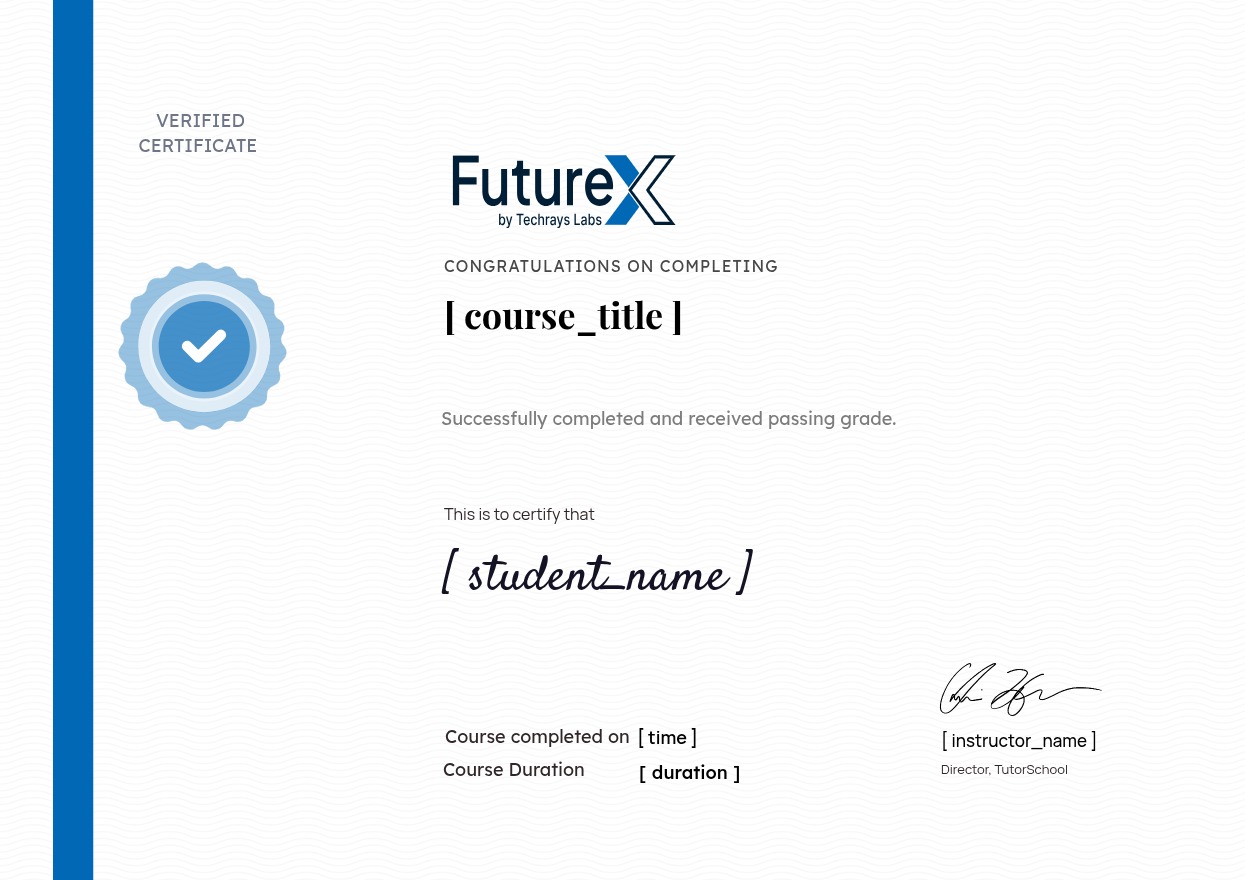
Earn a certificate
Add this certificate to your resume to demonstrate your skills & increase your chances of getting noticed.
Student Ratings & Reviews