About Course
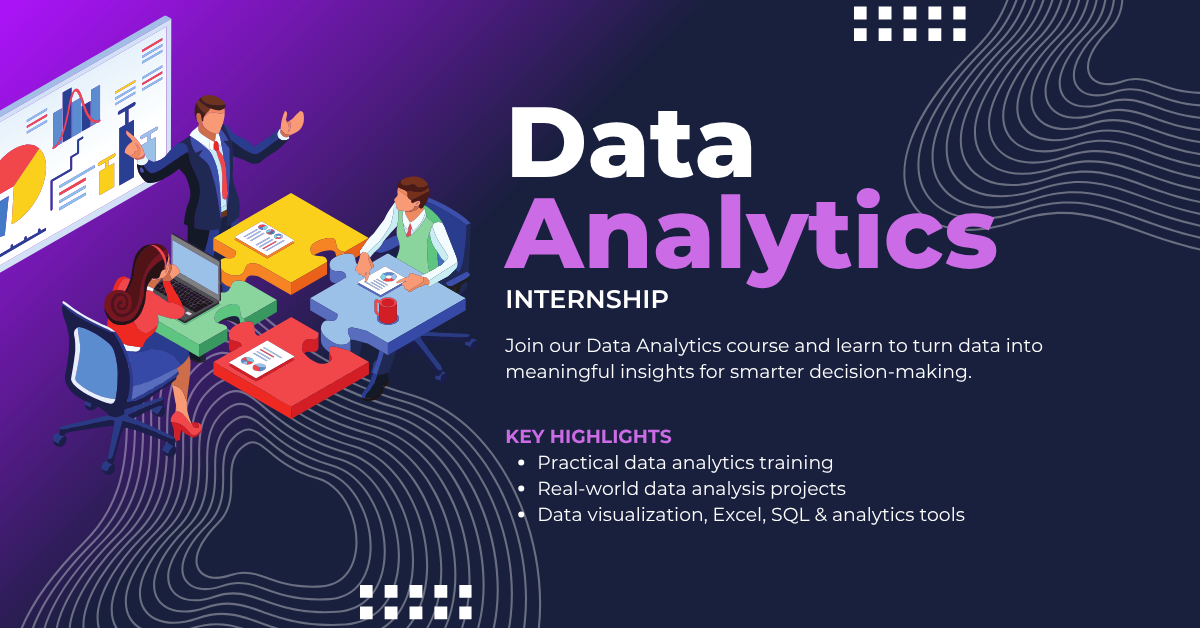
This 1-month Data Analytics Internship is a fast-paced, practical training program designed to help beginners develop strong analytical thinking and real-world data handling skills using modern data analytics tools and techniques.
The program follows a structured learning approach that starts from the fundamentals of data analysis and gradually progresses toward data visualization, business reporting, dashboard creation, and insight generation. It is designed to provide both conceptual understanding and hands-on analytical experience through real-world datasets, assignments, quizzes, and practical projects.
🚀 What This Internship Covers
The internship begins with the fundamentals of Data Analytics, where learners understand the role of data in modern businesses and how organizations use analytics for decision-making. Students learn the basics of data collection, data types, data cleaning, and data interpretation, building a strong foundation for analytical workflows.
Once the basics are established, the program moves into Spreadsheet and Data Handling techniques using Excel or Google Sheets. Learners work with formulas, functions, sorting, filtering, conditional formatting, pivot tables, charts, and basic reporting methods. These concepts help students organize and analyze raw business data efficiently.
Next, students are introduced to SQL and Database Analysis, where they learn how to retrieve, filter, manipulate, and analyze data stored in relational databases. They gain practical experience with queries, joins, aggregations, grouping, and real-world business reporting scenarios using SQL.
The internship then transitions into Data Visualization and Dashboard Development, where learners create interactive charts, graphs, KPIs, and dashboards using tools like Power BI or Tableau. Students learn how to convert raw datasets into meaningful visual insights that support business decisions and performance tracking.
In the final phase, learners apply all acquired skills by working on a real-world analytics project such as Sales Performance Analysis, Customer Behavior Analysis, or Business Insights Dashboard Creation. This project simulates actual industry-level analytical workflows including data cleaning, visualization, reporting, and insight generation.
🧠 Learning Approach
This internship is not limited to theory; it is designed around practical implementation, real datasets, and continuous evaluation. Each module includes:
-
Structured video/text lessons
-
Real-world datasets and analytical exercises
-
Module-wise quizzes to test understanding
-
Assignments and mini-projects
-
Dashboard creation activities
-
A final capstone analytics project
Progression is sequential, meaning learners must complete quizzes and assignments before moving to advanced analytical concepts. This ensures strong understanding of data analysis fundamentals before working on business-level datasets.
🏆 Skills You Will Gain
By the end of this internship, participants will be able to:
-
Understand the complete data analytics workflow
-
Clean, organize, and process raw datasets
-
Perform data analysis using Excel and SQL
-
Create charts, reports, and dashboards
-
Generate business insights from data
-
Work with pivot tables and analytical formulas
-
Build interactive dashboards using Power BI or Tableau
-
Understand KPI tracking and reporting systems
-
Analyze customer, sales, and operational data
-
Present analytical findings professionally
🎯 Who This Internship is For
This program is ideal for:
-
Beginners interested in data analytics careers
-
Students from computer science, commerce, business, or IT backgrounds
-
Individuals wanting to enter analytics and business intelligence fields
-
Aspiring Data Analysts and Business Analysts
-
Freelancers and professionals looking to improve analytical skills
No prior analytics experience is required, but regular practice and project completion are essential for successful learning.
💼 Internship Outcome
Upon completion of this internship, learners will have practical experience in handling, analyzing, and visualizing business data using industry-relevant tools and workflows. They will also complete a portfolio-ready analytics project that demonstrates their ability to generate meaningful insights from raw datasets, significantly improving their readiness for entry-level Data Analyst and Business Intelligence roles.
Course Content
Module 1: Introduction to Data Analysis & Core Tools
-
Introduction to Data Analytics
-
Excel for Data Analysis Basics
-
Python Setup for Data Analysis
-
Data Cleaning Basics
-
Check what have you learnt about Introduction to Data Analytics Basics
-
Basic Sales Data Cleaning & Summary Repor
Module 2: Data Wrangling, SQL Basics & Exploratory Data Analysis (EDA)
Module 3: Advanced Data Analysis, Statistics & Business Insights
Module 4: End-to-End Data Analytics Capstone Project (LMS Structured)
Earn a certificate
Add this certificate to your resume to demonstrate your skills & increase your chances of getting noticed.