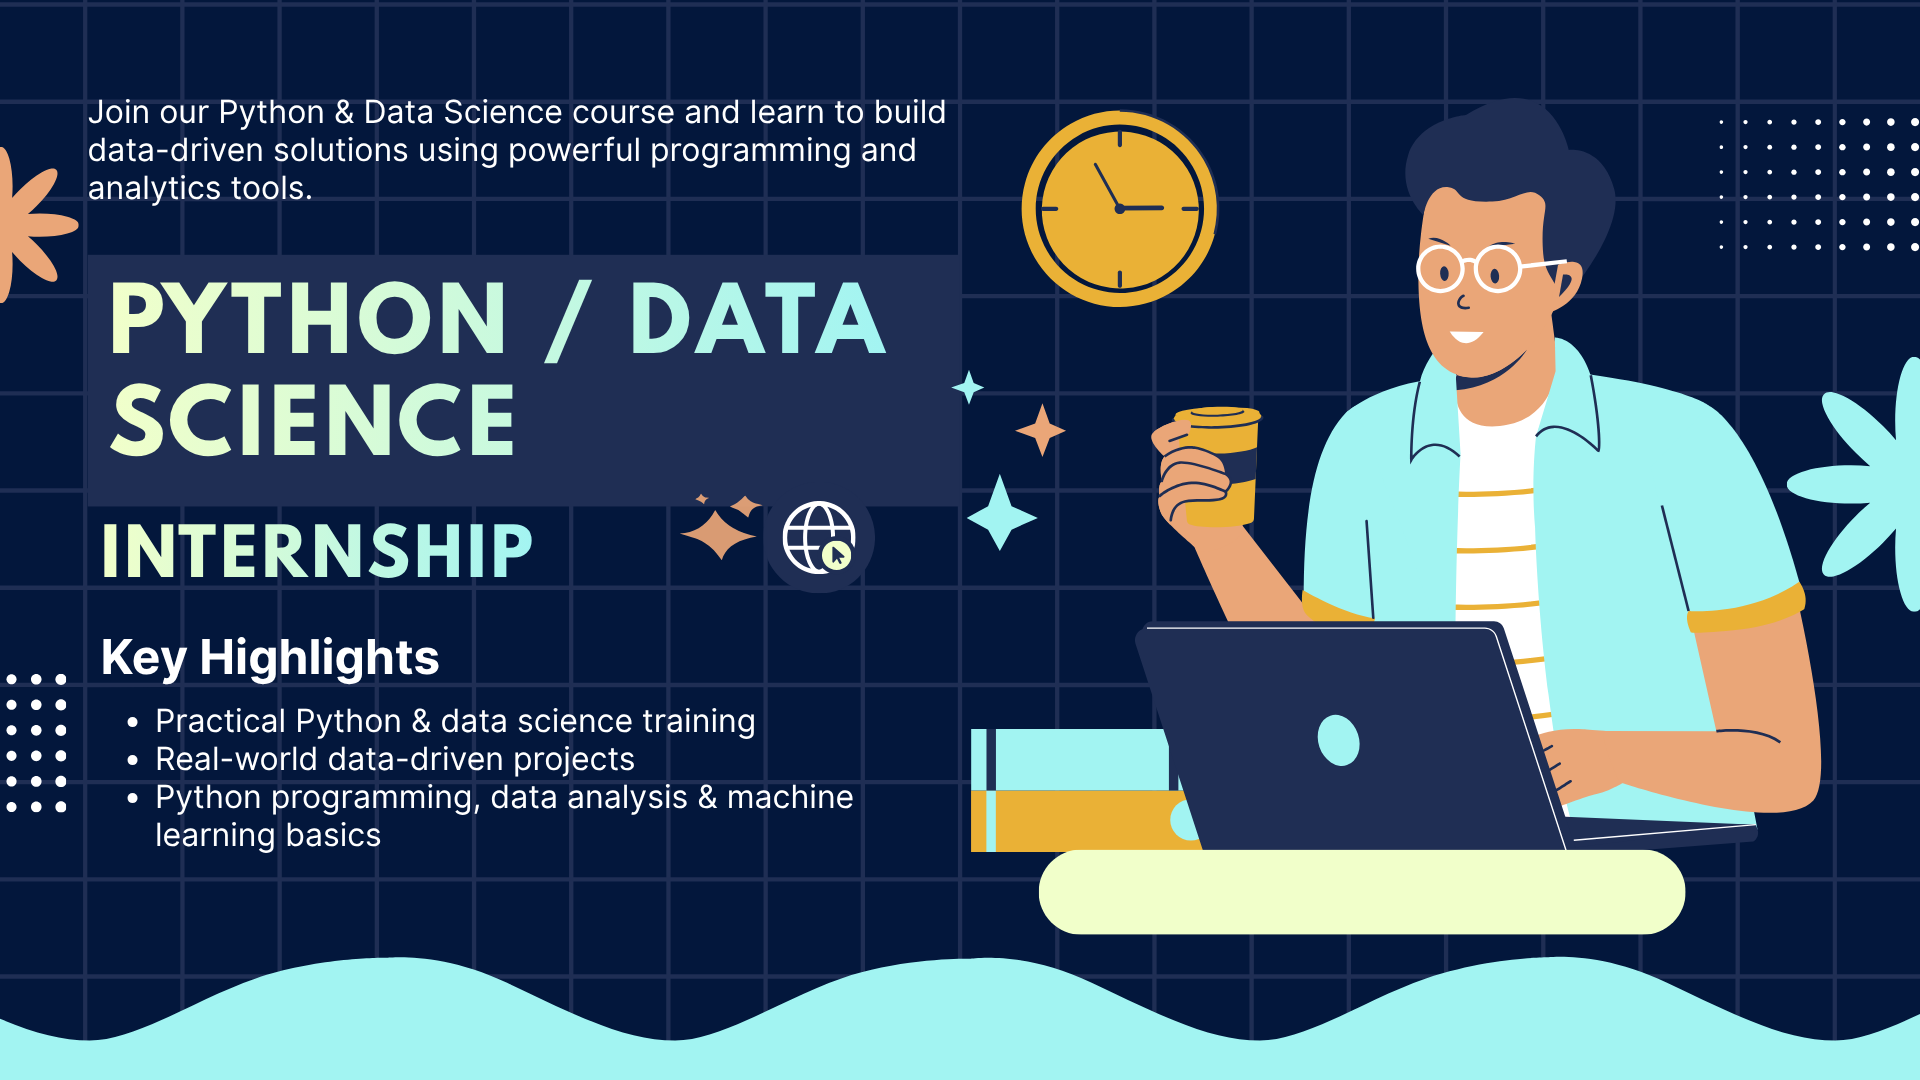
2 Months Python / Data Science Training & Internship

Categories: Training & Internship
Wishlist Share

About Course

This 2-month Python / Data Science Internship is a comprehensive, structured training program designed to transform beginners into job-ready Python and data science professionals with strong analytical thinking, programming, and problem-solving skills using Python and modern data science technologies.

The program follows a progressive learning approach, starting from core Python programming fundamentals and gradually advancing toward real-world data analysis, visualization, and machine learning concepts. It is designed to provide both conceptual clarity and hands-on practical experience through coding exercises, assignments, quizzes, datasets, and project-based learning.

🚀 What This Internship Covers

The internship begins with the fundamentals of Python programming, where learners understand core concepts such as variables, data types, operators, conditional statements, loops, functions, and basic problem-solving techniques. This phase builds a strong programming foundation and ensures that even beginners with no prior coding experience can comfortably start learning Python.

Once the basics are established, the program moves into Object-Oriented Programming (OOP) in Python, where learners gain understanding of classes, objects, inheritance, polymorphism, encapsulation, and abstraction. These concepts help students write clean, modular, and reusable code for real-world applications.

Next, students are introduced to Data Handling and Analysis using NumPy and Pandas. Learners work with arrays, DataFrames, data cleaning, filtering, sorting, aggregation, and transformation techniques. They learn how to process structured datasets and extract meaningful insights from raw data using industry-standard Python libraries.

The internship then transitions into Data Visualization, where students create professional charts and graphs using Matplotlib and Seaborn. Concepts such as bar charts, line graphs, histograms, heatmaps, scatter plots, and dashboard-style reporting are covered to help learners present data effectively and visually.

After building analytical foundations, learners are introduced to the basics of Machine Learning, where they understand supervised and unsupervised learning concepts, model training, prediction workflows, and evaluation techniques using Scikit-learn. Students gain exposure to real-world machine learning pipelines and predictive analysis concepts.

In the final phase, learners apply everything they have learned by building a complete real-world Data Science Project, such as Sales Prediction, Customer Analysis, or Student Performance Prediction. This project includes data cleaning, analysis, visualization, and basic machine learning implementation, simulating real industry-level workflows.

🧠 Learning Approach

This internship is not just theory-based; it is designed around practical implementation and continuous evaluation. Each module includes:

  • Structured video/text lessons

  • Coding examples and exercises

  • Dataset-based practice tasks

  • Module-wise quizzes to test understanding

  • Assignments and mini-projects

  • Real-world data analysis practice

  • A final capstone project

Progression is strictly sequential, meaning learners must successfully complete quizzes and assessments to unlock the next module. This ensures strong conceptual clarity before moving to advanced topics.

🏆 Skills You Will Gain

By the end of this internship, participants will be able to:

  • Write clean and efficient Python programs

  • Understand and apply Object-Oriented Programming principles

  • Work with NumPy for numerical computing

  • Analyze datasets using Pandas

  • Clean and preprocess raw data

  • Create professional data visualizations

  • Perform exploratory data analysis (EDA)

  • Understand basic machine learning workflows

  • Build simple predictive models using Scikit-learn

  • Work on real-world Python and Data Science projects

  • Present analytical insights effectively

🎯 Who This Internship is For

This program is ideal for:

  • Beginners who want to start a career in Python or Data Science

  • Students pursuing computer science, IT, or analytics-related fields

  • Individuals interested in AI, Machine Learning, and Data Analytics

  • Developers looking to strengthen Python programming skills

  • Anyone aiming for Data Science or Python Developer roles

No prior programming experience is required, but consistency, logical thinking, and regular practice are essential for successful completion.

💼 Internship Outcome

Upon completion of this internship, learners will have practical experience in Python programming, data analysis, visualization, and basic machine learning workflows. Participants will be capable of working with real-world datasets, building analytical solutions, and creating data-driven projects using Python.

They will also have a portfolio-level capstone project that can be showcased to potential employers, significantly improving their chances of placement in Python Developer, Data Analyst, Junior Data Scientist, or Machine Learning Internship roles.

Show More

Course Content

Module 1: Python Fundamentals for Data Science
This module establishes the programming foundation required for every data science workflow. Before working with libraries like NumPy, Pandas, or machine learning frameworks, students must first understand how Python behaves as a language. Data science is not only about tools; it is about writing clean logic to process, analyze, and automate data operations. That logic begins here. Python is the most widely used language in data science because it is readable, efficient, and supported by a massive ecosystem of analytical libraries. However, most beginners fail in data science not because Pandas is difficult, but because their Python fundamentals are weak. This module fixes that problem first. Students will learn how Python stores information, how decisions are made in programs, how repetition works using loops, and how reusable logic is written through functions. These concepts are not theoretical—they directly control how data is filtered, transformed, and analyzed in real-world projects. This module is intentionally practical. Every lesson is designed around the kind of logic students will repeatedly use later in analytics, automation, and preprocessing tasks. Instead of treating Python as generic programming, this module teaches Python as a working tool for data science. By the end of this module, students will be able to write structured Python programs, perform logic-based operations, automate repetitive tasks, and build small utility programs that resemble real data-processing workflows.

  • Variables, Data Types, and Input Handling
  • Operators and Expressions
  • Conditional Statements
  • Loops and Functions
  • Check what have you learnt about Python Fundamentals Assessment
  • Student Grade Evaluation System

Module 2: Numerical Computing with NumPy
This module introduces NumPy, the foundational numerical computing library in Python and one of the most important tools in the entire data science ecosystem. Once students understand Python fundamentals, the next step is learning how to handle numerical data efficiently. Standard Python lists are flexible, but they are slow, memory-heavy, and inefficient for serious analytical work. NumPy solves that problem. NumPy is the engine behind most scientific computing in Python. It provides fast, memory-optimized, multi-dimensional arrays and highly efficient mathematical operations. Most major data science libraries such as Pandas, Scikit-learn, and even parts of deep learning frameworks rely heavily on NumPy internally. This means NumPy is not optional—it is structural. Students will learn how NumPy arrays differ from normal Python lists, why vectorized computation is faster than loops, how slicing and indexing work in numerical datasets, and how statistical operations can be performed in a few optimized commands. This module is practical, not theoretical. The goal is not to memorize NumPy syntax but to understand how numerical data is processed efficiently. This module matters because almost every real dataset eventually becomes numbers. Whether students are working with sales values, temperatures, financial records, sensor readings, image pixels, or machine learning features, those values are ultimately handled as numerical arrays. NumPy is the system that makes that possible at scale. By the end of this module, students will be able to create and manipulate NumPy arrays, perform efficient mathematical operations, apply slicing and filtering, and calculate statistical summaries required for data analysis and preprocessing.

Module 3: Data Analysis with Pandas
This module introduces Pandas, the most important Python library for working with structured data in real-world data science. After learning NumPy for fast numerical computation, students now move into practical dataset handling where information is stored in rows and columns, similar to Excel sheets or SQL tables. Pandas is the standard tool used by analysts and data scientists to load, inspect, clean, transform, and analyze datasets efficiently. In real business environments, raw data rarely arrives in a perfect format. It often contains missing values, duplicate rows, inconsistent formats, and unnecessary columns. Pandas is built specifically to solve these problems and make data usable for analysis. This module focuses on practical data operations that students will perform daily in real data roles: loading CSV files, understanding dataset structure, selecting rows and columns, filtering records, cleaning missing values, and generating simple summaries. Students will learn not only how Pandas works, but why it is used in every serious data workflow. By the end of this module, students will be able to load structured datasets, inspect their quality, clean inconsistencies, filter useful information, and perform essential analysis tasks confidently. This module acts as the bridge between raw data and meaningful insights, making it one of the most important stages in the internship. 📊 Difficulty Level: Intermediate

Module 4: Data Visualization Basics (Matplotlib & Seaborn)
This module introduces data visualization, one of the most critical skills in data science and analytics. After learning how to load, clean, and analyze data using Pandas, the next step is presenting that data in a visual format that humans can understand quickly. Raw numbers in tables are useful for storage, but visualizations reveal trends, patterns, comparisons, and anomalies much faster than plain numerical output. In real-world analytics, charts are not optional. Businesses use visual reports to make decisions, managers use graphs to monitor performance, and analysts use visual exploration to detect trends hidden in raw datasets. A poorly analyzed chart can lead to wrong conclusions, while a well-designed one can expose valuable insights immediately. This module focuses on the two most widely used visualization libraries in Python: Matplotlib and Seaborn. Matplotlib is the foundational plotting library used to build nearly every type of chart in Python. Seaborn is built on top of Matplotlib and simplifies statistical visualization while producing cleaner, more professional-looking charts. Students will learn how to create line charts, bar charts, histograms, scatter plots, and heatmaps. They will also learn when to use each chart, how to interpret results, and how visualizations support decision-making in real analysis workflows. By the end of this module, students will be able to convert raw data into meaningful visual reports, identify patterns visually, and present insights clearly using professional charting tools.

Module 5: Basic Statistics for Data Science
This module introduces the statistical foundation required for data science and analytics. After learning how to load, clean, and visualize data, students now move into the mathematical layer of data interpretation. Data science is not only about writing code or drawing charts. It is about understanding what the data actually means, how values behave, and whether the patterns observed are reliable or misleading. Statistics provides that foundation. In real-world data science, statistics is used to summarize datasets, measure variation, identify relationships, and support decision-making. Businesses do not make decisions from raw tables alone. They rely on statistical summaries such as averages, variability, and trends to evaluate performance, forecast outcomes, and compare behavior across categories. This module focuses on practical statistics rather than academic theory. Students will learn the statistical concepts most frequently used in data science workflows: mean, median, mode, variance, standard deviation, correlation, and data distribution. These are the exact tools analysts use to understand dataset behavior before applying machine learning or predictive modeling. Students will also learn how to calculate these metrics in Python using NumPy, SciPy, and visualization tools. The goal is not to memorize formulas blindly, but to understand what each metric means, when it should be used, and how to interpret it correctly. By the end of this module, students will be able to summarize data statistically, measure spread and consistency, identify relationships between variables, and interpret data patterns with stronger analytical confidence.

Module 6: Final Capstone Project – End-to-End Data Analysis
This final module is the execution layer of the complete internship. Every concept learned in previous modules—Python fundamentals, NumPy operations, Pandas data handling, data visualization, and statistical reasoning—comes together here in one real-world workflow. This module is not theory-driven. It is built to simulate how a real data analyst works inside a company when given raw business data and asked to extract decisions from it. Students will work on a complete business dataset from start to finish. That means they will not only read data and generate charts, but also inspect quality issues, clean inconsistencies, engineer useful metrics, identify business trends, and present conclusions in a structured format. This is the exact workflow used in analytics teams across e-commerce, finance, operations, logistics, and product companies. Unlike previous modules where each topic was isolated, this module forces students to think like analysts. They must decide what matters in the dataset, what should be cleaned, which patterns are meaningful, and how to communicate results in a way a business can use. That is the core difference between learning tools and doing actual analysis. This module is designed to produce a portfolio-grade project. The output should not look like practice work. It should look like something a junior analyst can show during interviews to demonstrate practical skill in handling real datasets and extracting actionable insights. By the end of this module, students will be able to perform a complete end-to-end data analysis workflow independently, from raw CSV to final insight report, using industry-standard Python tools and structured analytical thinking.

Earn a certificate

Add this certificate to your resume to demonstrate your skills & increase your chances of getting noticed.
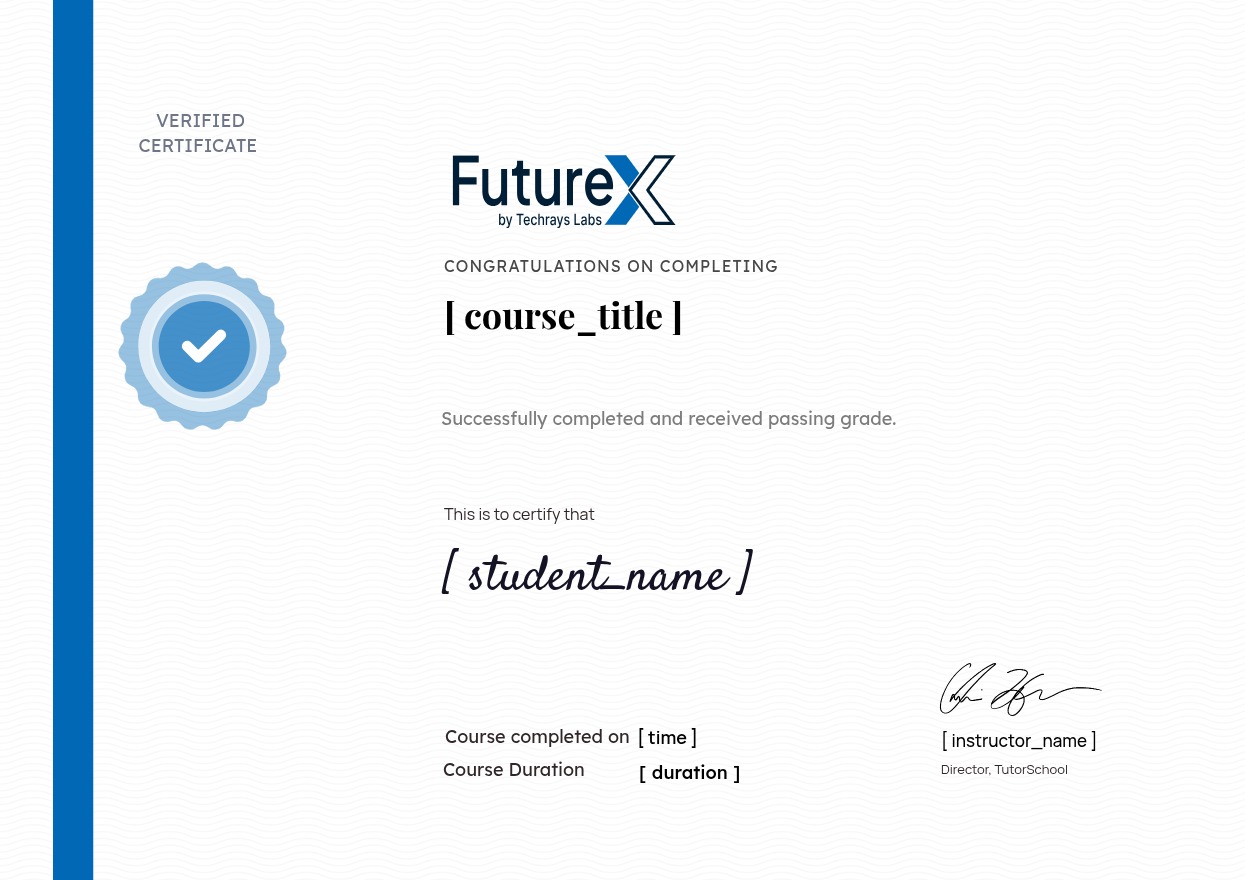
selected template

Student Ratings & Reviews

No Review Yet
No Review Yet