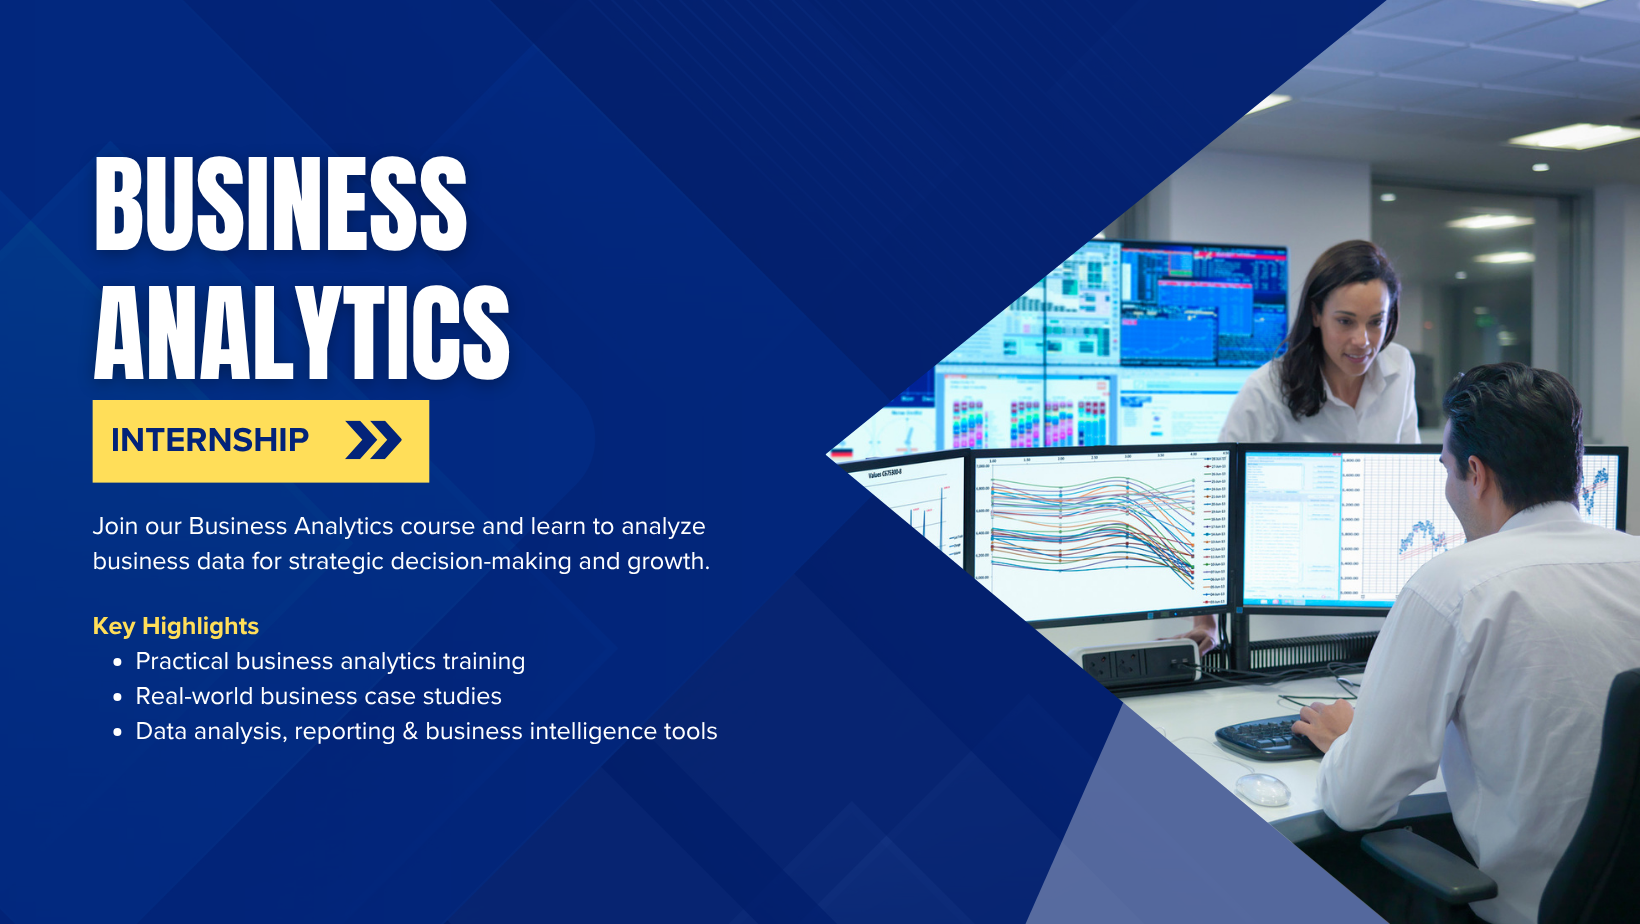
6 Months Business Analytics Training & Internship

Categories: Training & Internship
Wishlist Share

About Course

This 6-month Business Analytics Internship is a comprehensive, industry-oriented training program designed to transform beginners into job-ready business analysts with strong analytical thinking, data interpretation, reporting, and decision-making skills using modern business intelligence and analytics tools.

The program follows a structured and progressive learning approach, starting from the fundamentals of business analysis and gradually advancing toward real-world data analytics, dashboard development, reporting automation, and business decision support systems. It is designed to provide both conceptual understanding and practical hands-on experience through real-world case studies, assignments, quizzes, and project-based learning.

🚀 What This Internship Covers

The internship begins with the fundamentals of business analytics, where learners understand how businesses use data to make informed decisions. Students learn core concepts such as data collection, business metrics, KPIs, data-driven decision making, reporting structures, and analytical thinking. This foundation helps beginners understand the role of analytics in modern organizations.

Once the basics are established, the program moves into Microsoft Excel and spreadsheet analytics, which remain essential tools for business analysts. Learners gain hands-on experience with formulas, functions, pivot tables, lookup functions, conditional formatting, dashboards, charts, and data cleaning techniques. Practical exercises help students analyze and visualize business data effectively.

The internship then introduces SQL and database analysis, where students learn how to work with relational databases and retrieve meaningful insights from large datasets. Topics include database fundamentals, SELECT queries, filtering, sorting, joins, grouping, aggregation, subqueries, and data analysis using SQL. Learners practice writing queries for real business scenarios and reporting requirements.

Next, students explore data visualization and business intelligence tools such as Power BI or Tableau. They learn how to transform raw business data into interactive dashboards and meaningful reports. Concepts such as data modeling, KPI dashboards, charts, filters, slicers, and business reporting are covered in depth to help learners present insights clearly and professionally.

The program also covers statistics and analytical concepts essential for business decision-making. Learners understand trends, forecasting, probability basics, performance analysis, customer insights, and business reporting techniques. They learn how to interpret data patterns and convert analytical findings into actionable business recommendations.

In the final phase, students apply everything they have learned by building a complete real-world Business Analytics Project, such as Sales Performance Analysis, Customer Insights Dashboard, Financial Reporting System, or E-commerce Analytics Dashboard. This project simulates real industry workflows involving data collection, cleaning, analysis, visualization, and business reporting.

🧠 Learning Approach

This internship is designed around practical implementation, continuous evaluation, and real-world business problem-solving. Each module includes:

  • Structured video/text lessons

  • Real-world business case studies

  • Practical datasets and analytics exercises

  • Dashboard creation assignments

  • Module-wise quizzes and assessments

  • Mini-projects for hands-on learning

  • A final capstone analytics project

Progression is strictly sequential, meaning learners must successfully complete quizzes and assessments before advancing to the next module. This ensures strong conceptual clarity and practical understanding at every stage.

🏆 Skills You Will Gain

By the end of this internship, participants will be able to:

  • Understand business analytics concepts and workflows

  • Analyze and interpret business data effectively

  • Use Microsoft Excel for advanced data analysis

  • Write SQL queries for data extraction and reporting

  • Clean, organize, and transform datasets

  • Build interactive dashboards using Power BI/Tableau

  • Create KPI reports and business presentations

  • Perform business performance and trend analysis

  • Generate actionable insights from raw data

  • Work on real-world analytics and reporting projects

🎯 Who This Internship is For

This program is ideal for:

  • Beginners who want to start a career in Business Analytics

  • Students pursuing BBA, MBA, BCA, BCom, IT, or related fields

  • Individuals interested in data-driven business decision making

  • Professionals looking to transition into analytics roles

  • Anyone aiming for Business Analyst or Data Analyst roles

No prior analytics experience is required, but consistency, curiosity, and practice are essential for successful completion.

💼 Internship Outcome

Upon completion of this internship, learners will have practical experience in business analytics, reporting, and dashboard development. They will be capable of analyzing business data, creating professional reports, and supporting data-driven decision-making processes in organizations.

Participants will also complete a portfolio-ready real-world analytics project that can be showcased to potential employers, significantly improving their chances of placement in Business Analyst, Data Analyst, Reporting Analyst, or Business Intelligence roles.

Show More

Course Content

Module 1: Introduction to Business Analytics & Data Fundamentals
This module introduces students to the core concept of Business Analytics and how data drives modern decision-making in organizations. Students will understand what business analytics means, why companies rely on it, and how raw data is transformed into meaningful insights. You will also learn different types of data, data sources, and the role of tools like Excel in analytics workflows. This foundation is essential before moving into advanced tools like SQL, Power BI, or Python. By the end of this module, learners will be able to identify business problems that can be solved using data and understand basic data handling concepts. This is the first step toward becoming a professional data-driven decision maker.

  • What is Business Analytics?
  • Data Types & Sources in Business Analytics
  • Excel Basics for Business Analytics
  • Check what have you learnt about Introduction to Business Analytics
  • Basic Sales Data Analysis Report

Module 2: Statistics Foundations for Business Analytics
This module introduces the core statistical concepts required for business analytics. Students will learn how to summarize, interpret, and analyze data using descriptive and inferential statistics. Understanding statistics is critical because every business decision backed by data relies on statistical interpretation. From calculating average sales to understanding customer trends, statistics forms the backbone of analytics. This module also introduces variability, probability, and data preparation techniques used in real-world analytics pipelines. You will begin to see how raw numbers are transformed into meaningful insights. By the end of this module, learners will be able to confidently interpret datasets, identify patterns, and prepare data for further analysis using tools like Excel and Python.

Module 3: Advanced Excel for Business Analytics & Data Visualization Basics
This module focuses on advanced Excel skills and introduces the fundamentals of data visualization, which is one of the most critical parts of business analytics. Students will learn how to manipulate large datasets using powerful Excel functions, summarize data using pivot tables, and present insights using charts and dashboards. Excel is still one of the most widely used tools in the industry, especially in reporting, finance, operations, and marketing analytics. Mastering Excel gives you a strong foundation before moving into tools like Power BI or Tableau. You will also learn how to visually communicate data insights effectively, which is essential for decision-making in real business environments. By the end of this module, learners will be able to analyze complex datasets, create professional reports, and build basic dashboards.

Module 4: SQL Basics for Business Analytics
This module introduces SQL (Structured Query Language), one of the most important tools in business analytics. SQL is used to extract, manipulate, and analyze data stored in relational databases. Most real-world business data (customers, orders, payments, sales) is stored in databases, and SQL is the primary way analysts access it. You will learn how to retrieve data using queries, filter information, combine multiple tables, and perform basic analysis using SQL. This module forms a critical bridge between Excel-based analysis and advanced tools like Power BI and Python analytics. By the end, learners will be able to write basic SQL queries and extract meaningful business insights from databases.

Module 5: Introduction to Python for Business Analytics
This module introduces Python as a core programming language for business analytics. Python is widely used because it is simple, powerful, and has rich libraries for data analysis, visualization, and automation. You will learn how to write basic Python programs, work with variables, use data structures, and perform simple analytical operations. Python helps automate repetitive tasks that would otherwise take hours in Excel or SQL. It also forms the foundation for advanced analytics, machine learning, and AI. By the end of this module, learners will be able to write basic Python scripts and manipulate datasets for analysis purposes.

Module 6: Data Visualization with Python (Matplotlib & Seaborn)
Seaborn. Visualization is a critical skill in business analytics because it helps convert complex datasets into clear, understandable insights for decision-makers. You will learn how to create different types of charts such as line plots, bar charts, histograms, and heatmaps. You will also understand how to interpret visual patterns and trends in real business data. This module bridges the gap between raw data analysis and storytelling with data, which is essential for dashboards and reporting systems. By the end of this module, learners will be able to create professional-level visualizations for business insights

Module 7: Introduction to Power BI & Business Intelligence
This module introduces Power BI, one of the most widely used Business Intelligence (BI) tools in the industry. Power BI helps transform raw data into interactive dashboards and reports that support business decision-making. Students will learn how to import data, create relationships, build visualizations, and design dashboards. The focus is on turning analyzed data into actionable business insights. Power BI is heavily used in companies for real-time reporting, KPI tracking, and executive dashboards. Understanding it is essential for any business analyst role. By the end of this module, learners will be able to create professional dashboards and perform basic BI reporting.

Module 8: Data Analysis Using Python (Pandas Advanced & Real-world Analytics)
This module focuses on advanced data analysis using Python’s Pandas library in real-world business scenarios. Students will move beyond basic DataFrames and learn how to clean, transform, group, and analyze large datasets like a professional data analyst. You will also learn how to handle missing data, perform group-based analysis, and derive meaningful business insights from raw datasets. This module is critical because most real-world analytics jobs involve heavy data manipulation before visualization or reporting. By the end of this module, learners will be able to independently analyze business datasets and generate actionable insights using Python.

Module 9: Predictive Analytics & Introduction to Machine Learning
This module introduces Predictive Analytics, which is the next level of business analytics where we move from understanding past data to predicting future outcomes. Students will learn the basics of machine learning concepts such as regression, classification, and model evaluation. The focus is not deep theory but practical business usage of prediction models. Predictive analytics is widely used in industries like finance, marketing, healthcare, and e-commerce for forecasting sales, predicting customer behavior, and identifying risks. By the end of this module, learners will understand how predictive models work and how they are used in real-world business decisions.

Module 10: Final Capstone Project – End-to-End Business Analytics System
This final module is a complete real-world capstone project where students apply everything learned throughout the internship. It simulates a professional business analytics project from raw data to final decision-making dashboards and predictions. Students will work on a full pipeline including data collection, cleaning, SQL querying, Python analysis, visualization, and dashboard creation. This project is designed to replicate real industry workflows used by business analysts in companies. It will test technical skills, analytical thinking, and business understanding together. By the end of this module, learners will have a complete portfolio project that can be showcased to employers.

Earn a certificate

Add this certificate to your resume to demonstrate your skills & increase your chances of getting noticed.

selected template

Student Ratings & Reviews

No Review Yet
No Review Yet